Notting Hill Property Prices
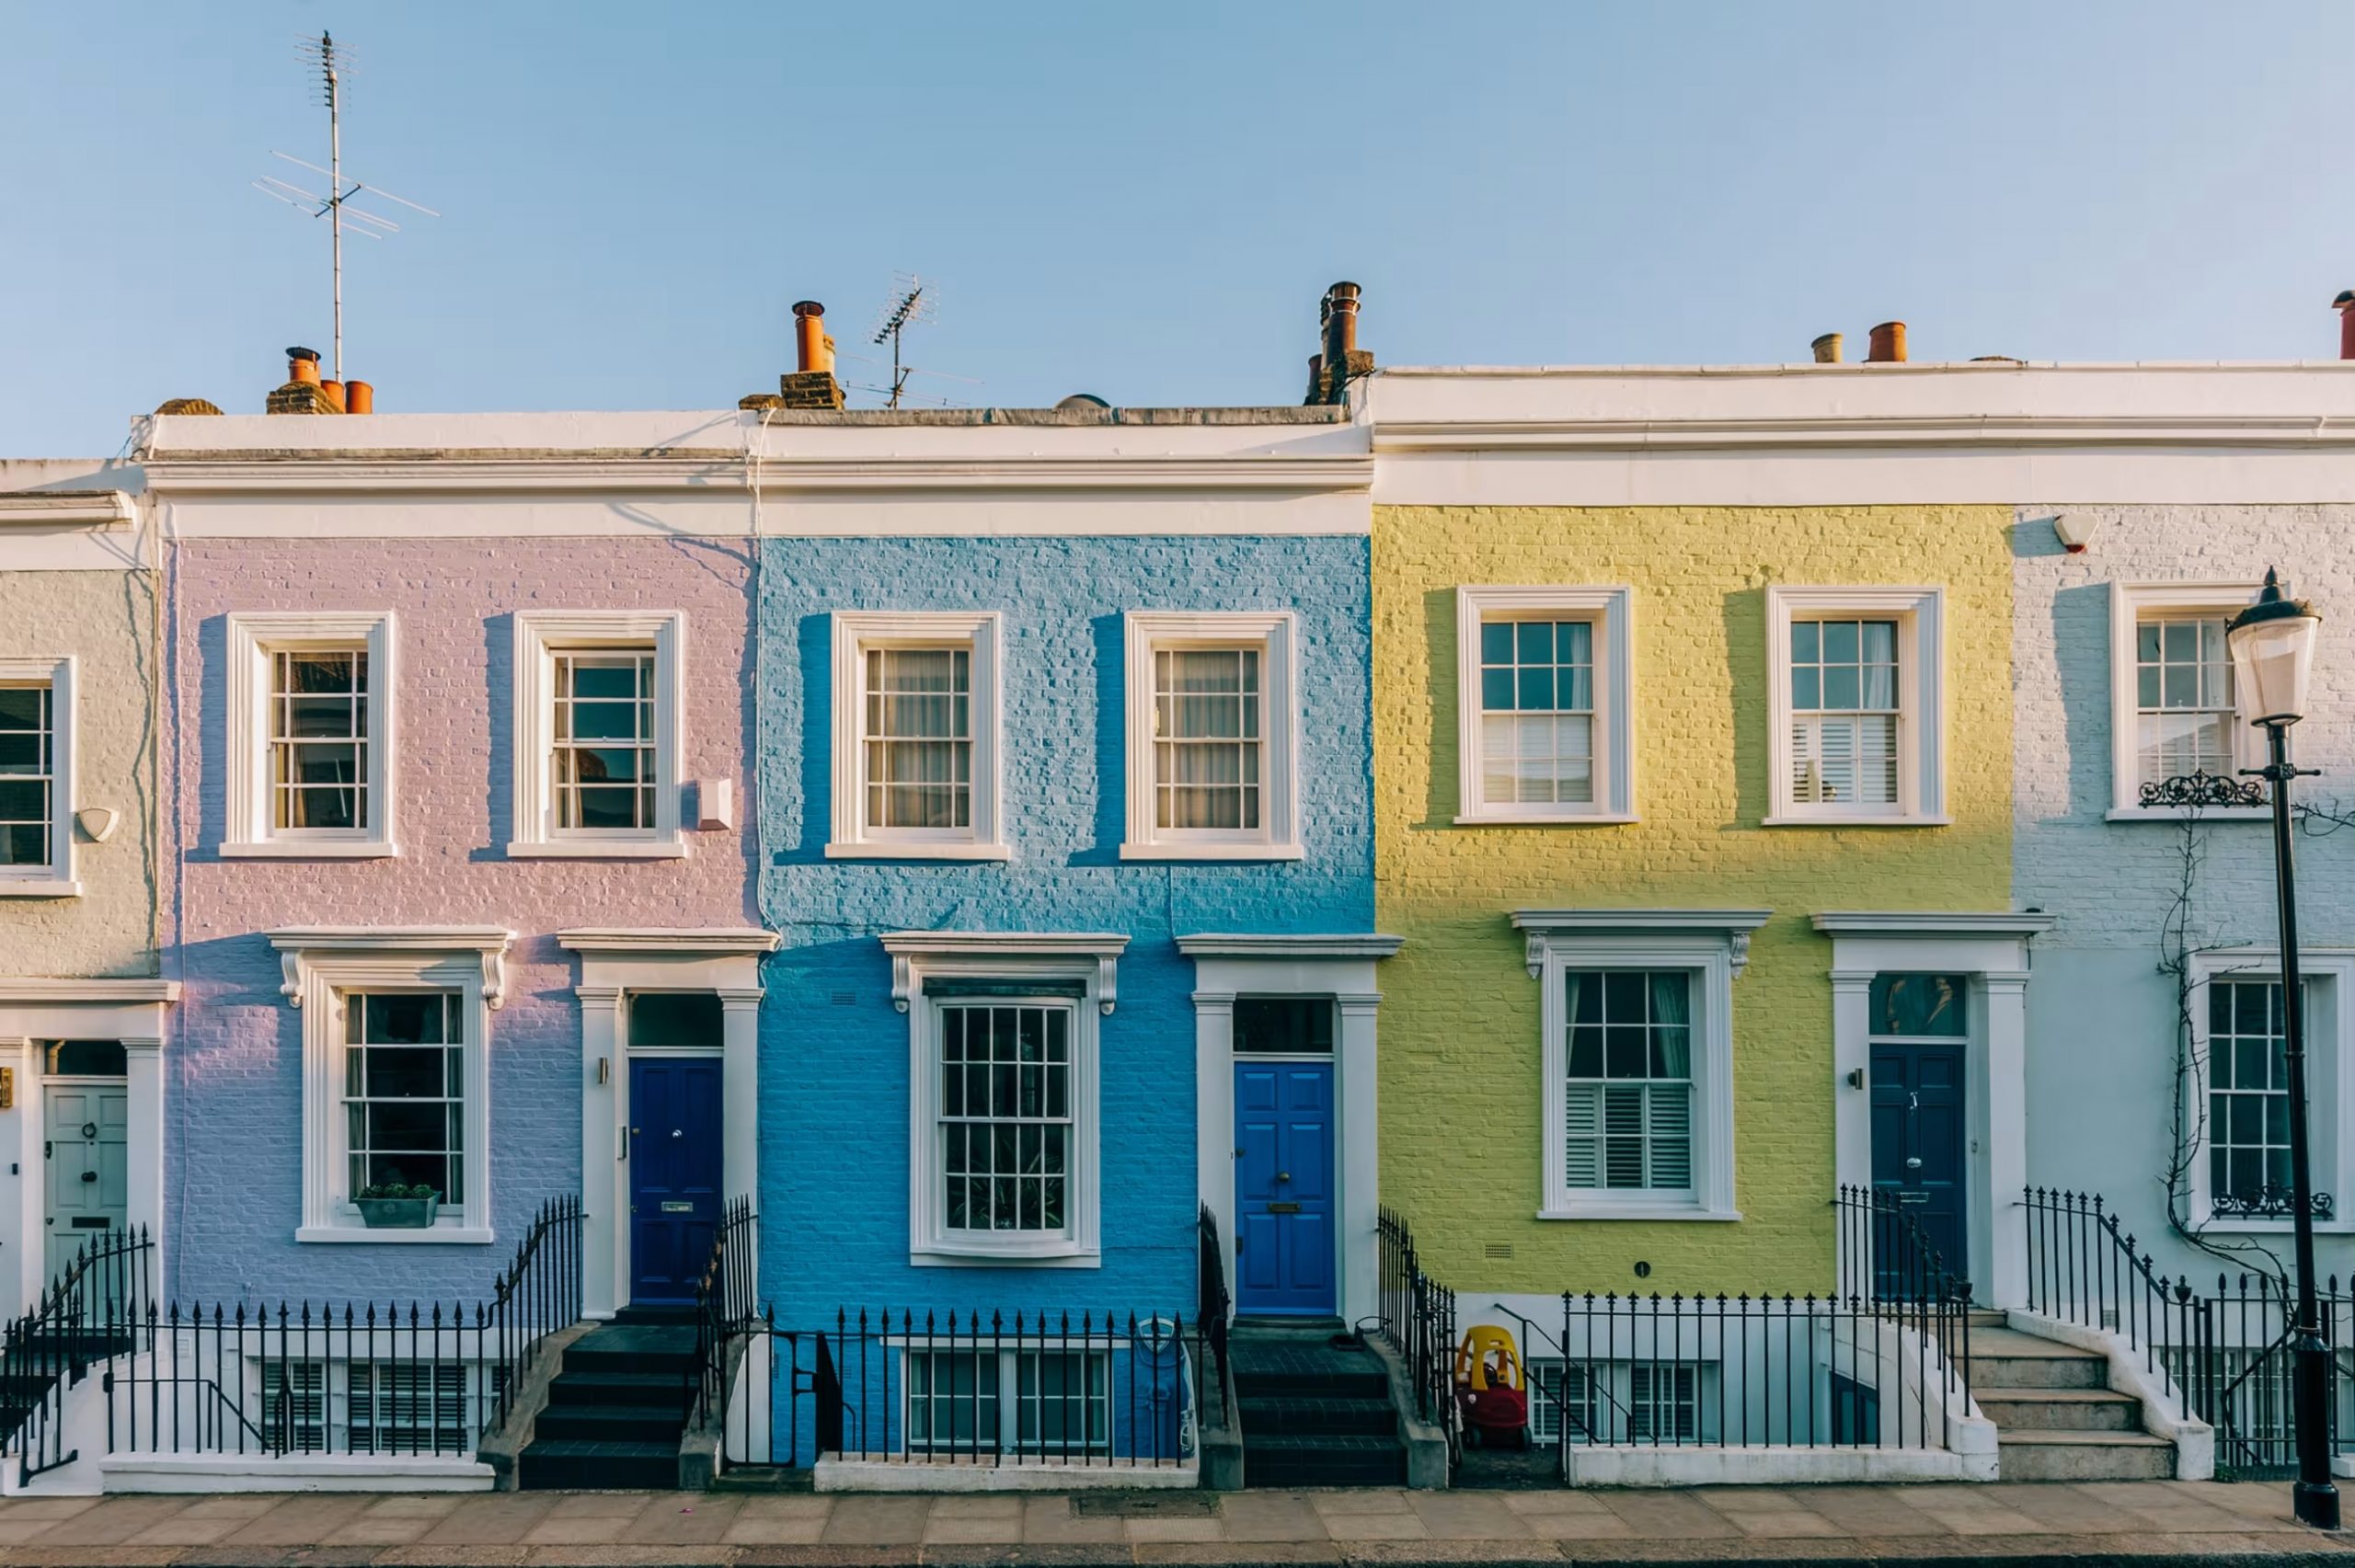
The Notting Hill area has 24,546 households and holds a population of 49,452.
We’ve assembled this data to share an insightful glimpse into the current real estate market of Notting Hill. Within our report lie recent sales statistics, property dimensions and price differentials spanning diverse property categories, from chic apartments to charming houses. Our intent is to arm you with a comprehensive understanding of the ever-evolving housing dynamics within this eclectic and sought-after locale.
On this page you will find:
Amount of Properties Sold by Bedroom in Notting Hill
2019 – 2023
Between 2019 and 2023, the property landscape in Notting Hill exhibited distinctive trends across different housing categories over 1,555 property sales in the period. The data illustrates that 1 to 2 bedroom properties constituted 300 units, indicating a notable demand for compact living spaces in the neighborhood. Meanwhile, larger properties, comprising 3 to 4 bedrooms, accounted for over 50% of the total, with 841 units, suggesting a prevalent preference for family-oriented housing options. Additionally, residences boasting 5 or more bedrooms represented just over 30% of the total, with 493 properties identified, catering to affluent residents or larger households including up to 9 bedrooms. This distribution highlights the diverse range of housing choices available in Notting Hill, accommodating various lifestyle preferences and needs.
- 1-2 Bedroom
- 3-4 Bedroom
- 5+ Bedroom
Average Sold Price in Notting Hill per year
2019 – 2023
The data illustrates a notable lack of significant fluctuation in average sold prices throughout the Notting Hill area between 2019 and 2023. The consistency observed in prices over this period, with only marginal variances, underscores a phase of remarkable stability within the real estate market, characterized by relatively minor alterations. The slight decline in average sold price in 2021, followed by a modest uptick in 2022, and another decrease in 2023, signifies exceptionally modest adjustments in the market, with properties maintaining their value amidst broader economic shifts.
- Average sold price (GBP)
Number of properties sold and price per Sqft in Notting Hill London between 2019 and 2023
| Year | Amount of properties sold | Average Sold Price | Average Sq/Ft | Average Price per Sq/Ft |
| 2019 | 240 | £2,144,320 | 1,339.65 | £1,432.60 |
| 2020 | 271 | £2,144,263 | 1,282.63 | £1,502.23 |
| 2021 | 375 | £2,111,878 | 1,287.24 | £1,442.58 |
| 2022 | 436 | £2,132,426 | 1,217.8 | £1,508.69 |
| 2023 | 233 | £1,987,195 | 1,189.66 | £1,447.48 |
The data from 2019 to 2023 reveals a trend in Notting Hill’s real estate market, where the average sold prices exhibit remarkable stability, while the average square footage and price per square foot undergo more noticeable changes. Despite the consistent average sold prices over these years, ranging between approximately £1,987,195 and £2,144,320, the average square footage experiences a gradual decline, from 1,339.65 square feet in 2019 to 1,189.66 square feet in 2023. Interestingly, this reduction in average square footage does not directly correlate with a decrease in the average price per square foot. Instead, the average price per square foot fluctuates slightly over the years, reaching its peak in 2022 at £1,508.69 and showing a slight decrease in 2023 to £1,447.48. This discrepancy suggests a nuanced interplay between property sizes and their corresponding values within the Notting Hill market.
Average property size in Notting Hill London of properties sold between 2019 - 2023
The data regarding the average square footage in Notting Hill showcases notable variations across different property categories. On average, 1-2 bedroom residences boast a modest size, with an average square footage of 896.35 square feet. In contrast, 3-4 bedroom properties offer significantly more space, averaging at 1749.45 square feet. The largest residences, those with 5 or more bedrooms, exhibit even more generous dimensions, boasting an average square footage of 3019.37 square feet. This breakdown underscores the diverse range of property sizes available within the Notting Hill area, catering to various lifestyle preferences and household needs.
Average property size in Notting Hill London of properties sold between 2019 -2023
- Sq/Ft
Tenure Type of Properties sold in Notting Hill between 2019 - 2023
The data reveals Notting Hill unveils an intriguing narrative of contrasting property ownership structures. Leasehold properties, comprising a significant 67% of the market, offer an enticing entry point into the neighborhood’s vibrant lifestyle. Despite their prevalence, these properties command a modest average price paid of £1,091,610.25, translating to an average price per square foot of £1,300. In contrast, the allure of freehold properties, though fewer in number at 33%, is undeniable. With their promise of unfettered ownership and control, they captivate discerning buyers, reflected in their considerably higher average price paid of £4,155,534.20. Moreover, the premium price per square foot of £1,816 further underscores the exclusivity and desirability associated with freehold ownership in Notting Hill. This juxtaposition of ownership types not only shapes the landscape of the neighborhood but also offers a glimpse into the diverse aspirations and preferences of its residents.
33%
Freehold Average Price Paid:
£4,155,534.20
Amount of properties sold: 514
Average price per sq/ft: £1,816
67%
Leasehold Average Price Paid:
£1,091,610.25
Amount of properties sold: 1,041
Average price per sq/ft: £1,300
Property prices for houses and flats sold in Notting Hill between 2019 - 2023
Delving into Notting Hill’s real estate mosaic unveils a captivating tapestry of diverse property types, each offering a unique allure and catering to varied lifestyles. At the upper echelon, detached houses stand as bastions of exclusivity, with their 15 transactions commanding an average price of £7,523,833. In contrast, semi-detached properties, though fewer in number at 47 transactions, boast an average price of £6,517,720, showcasing a blend of space and community living. Meanwhile, terraced houses emerge as the heartbeat of the neighborhood, with 439 transactions reflecting their enduring popularity and an average price of £3,754,853, making them accessible to a broader range of buyers. In the bustling urban landscape, flats dominate with 1,030 transactions, offering an affordable entry point into Notting Hill’s coveted postcode, with an average price of £1,105,120. These property types show the distinctive lifestyles and aspirations that embody Notting Hill’s vibrant community.
| Type | Amount | Average Price |
| Detached House | 15 | £7,523,833 |
| Semi-Detached | 47 | £6,517,720 |
| Terraced House | 439 | £3,754,853 |
| Flat | 1,030 | £1,105,120 |
Average price by Type
- Average sold price (GBP)
Are you contemplating selling or purchasing a property in Notting Hill and in need of expert guidance?
Our team of seasoned professionals is poised to support you throughout your journey. Whether you’re eager to list your property or embark on the quest for your dream home, we’re committed to offering personalized advice crafted to suit your unique requirements.
Reach out today to kickstart your adventure in the dynamic Notting Hill real estate arena.

